For the complete Report please go to👉: Click Here
For the Dashboard please go to👉: Click Here
Exploratory data analysis:
What can we get from the data?
Basic analysis:
1. Distribution of complaint reasons and sub-reasons;
2. Analysis of complaint handling results;
3. Distribution of complaint sources;
4. The efficiency of handling urgent complaints;
5. The reason why cannot close the case with in 24H/urge so many time;
6. The impact of gender and membership level on complaints;
7. Region-specific complaint patterns;
8. Compensation amount info;
9. Distribution of the responsibility for complaints;
import numpy as np
import pandas as pd
import matplotlib.pyplot as plt
import seaborn as sns

# pd.set_option('display.max_columns', None)

#load the dataframe
path = '/Users/houjialyu/Documents/Documents/数据分析/项目/call_center/QA Data Analysis Test.xlsx'
df = pd.read_excel(path, sheet_name='data')

#check the basic info of the df:
print(df.info) #[1042 rows x 15 columns]
print(df.columns)
print(df.head())
print(df.tail())
#data cleaning
#check the duplicate rows:
print(df.duplicated().sum()) #0
#check the null value:
print(df.isnull().sum()) #there are 5 null values in the "subreason" column, fill them with "N"
df.fillna('N', inplace=True)
#check the 0 value:
print(df.values)
#Distribution of complaint reasons and sub-reasons:
re_sub_re = pd.DataFrame()
re_sub_re['count'] = df.groupby(['reason', 'subreason'])['complaintsid'].count()
re_sub_re['pct'] = re_sub_re['count'].apply(lambda x: (x / re_sub_re['count'].sum()) * 100).round(2)
print(re_sub_re)
#Analysis of complaint handling results:
res = df.groupby(['result'])['complaintsid'].count()
print(res.sort_values(ascending=False))
#Distribution of complaint sources
src = df.groupby('source')['complaintsid'].count().reset_index()
src.columns = ['source', 'count']
src['pct'] = src['count'].apply(lambda x: (x / src['count'].sum())*100).round(2)
src.sort_values(by='pct', ascending=False, inplace=True)
plt.bar(
x=src['source'],
width=0.5,
height=src['pct'],
color='skyblue',
alpha=0.8
)
for x, y in enumerate(src['pct']):
plt.text(x, y, str(y) + '%', fontsize=10, ha='center', va='top')
plt.title("Distribution of Complaint Sources")
plt.show()
#the efficiency of handling urgent complaints:
df['urge_count'] = df['complaint_urge_count'].apply(lambda x: '<5' if x < 5 else('<10' if x < 10 else '>=10'))
pivot_t = pd.crosstab([df['isemergency'], df['urge_count']], df['is_closed_in_24h'], margins=True)
pivot_t['pct'] = pivot_t['All'].apply(lambda x: (x / pivot_t.loc['All', 'All']) * 100).round(2)
print(pivot_t)
#The reason why cannot close the case with in 24h/urge more than 5 times
re_sub_re2 = df[df['is_closed_in_24h'] == 'N'].groupby(['reason', 'subreason'])['complaintsid'].count()
re_sub_re2_filtered = re_sub_re2.apply(lambda x: x > 5)
print('The reason why cannot close the case with in 24h:\n {}'.format(re_sub_re2[re_sub_re2_filtered]))
print('--'*40)
re_sub_re3 = df[df['urge_count'] != '<5'].groupby(['reason', 'subreason'])['complaintsid'].count()
print('The reason why urge more than 5 times:\n {}'.format(re_sub_re3))
#The impact of gender and membership level on complaints:
gender = df.groupby(['gender'])['complaintsid'].count().reset_index()
gender.columns = ['gender', 'count']
plt.bar(
x=gender['gender'],
width=0.5,
height=gender['count'],
color='skyblue',
alpha=0.8
)
for x, y in enumerate(gender['count']):
plt.text(x, y, str(y), fontsize=10, ha='center', va='top')
plt.title("Distribution of Clients' Gender")
plt.show()
membership = df.groupby(['membergrade'])['complaintsid'].count().reset_index()
membership.columns = ['membergrade', 'count']
membership['pct'] = membership['count'].apply(lambda x: (x / membership['count'].sum())*100).round(2)
membership.sort_values(by='pct', inplace=True)
plt.barh(
membership['membergrade'],
membership['pct'],
height=0.5,
color='skyblue',
alpha=0.8
)
for x, y in enumerate(membership['pct']):
plt.text(y+7, x, str(y)+"%", fontsize=10, ha='right', va='center')
plt.title("Distribution of Clients' Member_grade")
plt.show()
#Region-specific complaint patterns:
region = df.groupby(['customer region'])['complaintsid'].count().reset_index()
region.columns = ['region', 'count']
region['pct'] = region['count'].apply(lambda x: (x / region['count'].sum())*100).round(2)
region_filtered = region['pct'].apply(lambda x: x > 5)
print(region[region_filtered].sort_values(by='pct', ascending=False))
#Compensation amount info:
compensation = df['compensation_amount_CNY'].describe().round(2)
print(df['compensation_amount_CNY'].sum().round(2))
print(compensation.median())
print(compensation)
#Distribution of the responsibility for complaints
resp = df.groupby(['responsibility'])['complaintsid'].count()
plt.pie(
resp,
labels=tuple(resp.index),
autopct='%.2f%%',
)
plt.show()Advanced analysis:
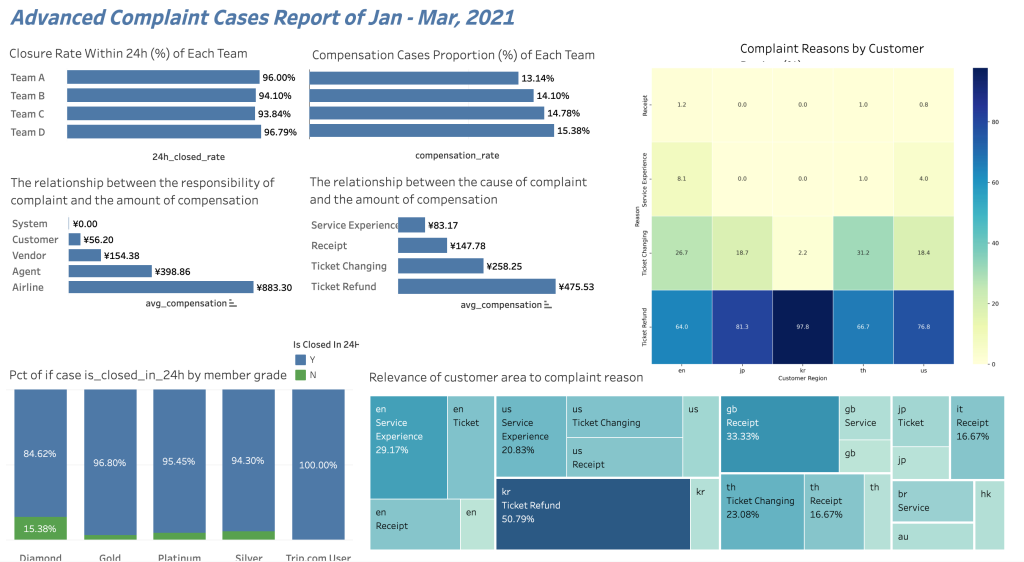
1. Relevance of customer area to complaint reason;
2. The correlation between complaint handling results and customer satisfaction;
2.1 The proportion of cases if can be completed within 24H at each membership level /reason+subreason;
2.2 Compensation strategy effect analysis;
3. Time series analysis;
4. Complaints handling team performance evaluation;
#Relevance of customer area to complaint reason
top_regions = df['customer region'].value_counts().index[:5]
top_reasons_data = df[df['customer region'].isin(top_regions)]
pivot_data = pd.crosstab(index=top_reasons_data['reason'], columns=top_reasons_data['customer region'], normalize='columns') * 100
plt.figure(figsize=(10, 8))
sns.heatmap(pivot_data, annot=True, fmt=".1f", linewidths=.5, cmap="YlGnBu")
# plt.title('Complaint Reasons by Customer Region (%)')
plt.ylabel('Reason')
plt.xlabel('Customer Region')
plt.tight_layout()
plt.savefig('/Users/houjialyu/Documents/Documents/数据分析/项目/call_center/reason_region.png', dpi=500)
plt.show()


#The correlation between complaint handling results and customer satisfaction:

#Even though our source data is missing a key indicator, the CSAT(Customer Satifaction),
#it can still be inferred through indirect indicators such as whether complaints are resolved within 24 hours
#and the size of the compensation amount:

fig, axs = plt.subplots(2, 1, figsize=(10, 18))

#The proportion of cases at each membership level that can be completed within 24H:
pivot_table_m = pd.crosstab(df['membergrade'], df['is_closed_in_24h'], normalize='index')*100
pivot_table_m.sort_values(by='N', inplace=True)
pivot_table_m.plot.barh(stacked=True, color=('r', 'skyblue'), alpha=0.8, ax=axs[0])

for i in range(len(pivot_table_m)):
    for j, val in enumerate(pivot_table_m.iloc[i]):
        if val != 0:
            axs[0].text((val/2)+2, i, f'{val:.2f}%', ha='center', va='center', fontsize=10, fontweight='bold')

axs[0].set_title('Pct of if case is_closed_in_24h by member grade')
axs[0].set_xlabel('Percentage')
axs[0].set_ylabel('Member Grade')
axs[0].legend(title='is_closed_in_24h')


#Compensation strategy effect analysis:
#The relationship between the cause of complaint and the amount of compensation
complaint_compensation = df.groupby(['reason'])['compensation_amount_CNY'].mean().round(2)
complaint_compensation.sort_values(ascending=False, inplace=True)
complaint_compensation.plot.bar(ax=axs[1], color='skyblue', alpha=0.8)
for x, y in enumerate(complaint_compensation):
    axs[1].text(x, y/2, y, ha='center', va='center', fontsize=10, fontweight='bold')
axs[1].set_ylabel('AVG of Compensation(CNY)')
axs[1].set_title('AVG Compensation(CNY) caused by different Reasons')

#The relationship between the responsibility of complaint and the amount of compensation
resp_compensation = df.groupby(['responsibility'])['compensation_amount_CNY'].mean().round(2)
resp_compensation.sort_values(ascending=False, inplace=True)
resp_compensation.plot.bar(ax=axs[2], color='skyblue', alpha=0.8)
for x, y in enumerate(resp_compensation):
    axs[2].text(x, y/2, y, ha='center', va='center', fontsize=10, fontweight='bold')
axs[2].set_ylabel('AVG of Compensation(CNY)')
axs[2].set_title('AVG Compensation(CNY) caused by different Responsibility')

plt.tight_layout()
plt.savefig('/Users/houjialyu/Documents/Documents/数据分析/项目/call_center/compensation_strategy.png', dpi=500)
plt.show()


#Compensation strategy effect analysis:
# calculate the mean compensation of the reason and responsibility
avg_compensation = df.groupby(['reason', 'responsibility'])['compensation_amount_CNY'].mean().reset_index()
# chart data prepare
reasons = avg_compensation['reason'].unique()
responsibilities = avg_compensation['responsibility'].unique()
stack_data = pd.DataFrame(index=reasons, columns=responsibilities).fillna(0)

for _, row in avg_compensation.iterrows():
    stack_data.loc[row['reason'], row['responsibility']] = row['compensation_amount_CNY']

total_compensation_by_reason = stack_data.sum(axis=1)
proportions_data = stack_data.divide(total_compensation_by_reason, axis=0)

bottom = pd.Series([0] * len(reasons), index=reasons)
colors = plt.cm.tab20(range(len(responsibilities)))

for responsibility, color in zip(responsibilities, colors):
    proportion = proportions_data[responsibility]
    bars = axs[1].bar(stack_data.index, stack_data[responsibility], bottom=bottom, label=responsibility, color=color)
    bottom += stack_data[responsibility]
    # add values label
    for bar, prop in zip(bars, proportion):
        height = bar.get_height()
        if height > 0:  # only label the bar != 0
            label_x_pos = bar.get_x() + bar.get_width() / 2
            label_y_pos = bar.get_y() + height / 2
            axs[1].text(label_x_pos, label_y_pos, f'{prop:.1%}', ha='center', va='center', color='white', fontsize=10, fontweight='bold')

axs[1].set_title('Average Compensation Amount by Reason and Responsibility with Proportions')
axs[1].set_xlabel('Reason')
axs[1].set_ylabel('Average Compensation Amount (CNY)')
axs[1].legend(title='Responsibility')
plt.xticks(rotation=45, ha="right")
plt.tight_layout()
plt.savefig('/Users/houjialyu/Documents/Documents/数据分析/项目/call_center/compensation_strategy.png', dpi=500)
plt.show()


# #Complaints handling team performance evaluation:
df['is_closed_in_24h_numeric'] = df['is_closed_in_24h'].apply(lambda x: 1 if x == 'Y' else 0)
closure_rate_within_24h_by_team = df.groupby(['Team'])['is_closed_in_24h_numeric'].mean() * 100

compensation_cases_proportion_by_team = (df[df['compensation_amount_CNY'] > 0].groupby('Team').size() / df.groupby('Team').size()) * 100

team_performance_metrics = pd.DataFrame({
    'Team': closure_rate_within_24h_by_team.index,
    'Closure Rate Within 24h (%)': closure_rate_within_24h_by_team.values,
    'Compensation Cases Proportion (%)': compensation_cases_proportion_by_team.values
})
# print(team_performance_metrics)

plt.figure(figsize=(14, 6))

plt.subplot(1, 2, 1)
sns.barplot(x='Closure Rate Within 24h (%)', y='Team', data=team_performance_metrics, palette='coolwarm')
for x, y in enumerate(team_performance_metrics['Closure Rate Within 24h (%)']):
    plt.text(y/2, x, f'{y:.2f}%', ha='center', va='center', fontsize=10, fontweight='bold')
plt.title('Closure Rate Within 24h by Team')

plt.subplot(1, 2, 2)
sns.barplot(x='Compensation Cases Proportion (%)', y='Team', data=team_performance_metrics, palette='coolwarm')
for x, y in enumerate(team_performance_metrics['Compensation Cases Proportion (%)']):
    plt.text(y/2, x, f'{y:.2f}%', ha='center', va='center', fontsize=10, fontweight='bold')
plt.title('Compensation Cases Proportion by Team')

plt.tight_layout()
plt.savefig('/Users/houjialyu/Documents/Documents/数据分析/项目/call_center/teams.png', dpi=500)
plt.show()